About This Tool
Why this ping tool measures HTTP round trips, not real ICMP packets
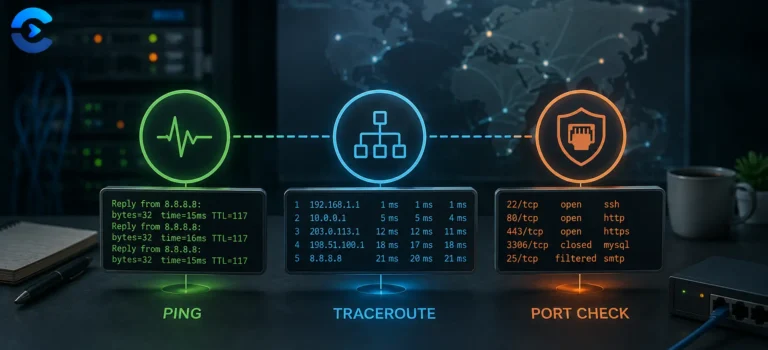
The word ping, in networking, means one specific thing: an ICMP echo request sent to a host, and an ICMP echo reply sent back, as defined in RFC 792. That protocol operates below the transport layer, using raw sockets that require operating system level privileges to open. Browsers do not expose raw sockets to JavaScript, full stop. No browser setting, extension, or workaround changes that, it is a deliberate sandboxing decision that keeps a web page from crafting arbitrary network packets.
So what this tool reports as milliseconds is something different, and worth naming precisely: the time an HTTP or HTTPS request takes. You choose where it is measured. Our server requests the host and reports the time to the first byte of the reply, along with the real HTTP status code. Your browser sends the requests itself and times them with performance.now(), so the numbers include your own connection. Both are real latency measurements, just not the same measurement ICMP ping produces.
What actually happens on each request
Step 1 Clean up the address
The host name or IPv4 address is checked, and any path is dropped. A port such as :8080 is kept. Without a scheme, the tool uses HTTPS, or HTTP for ports 80 and 8080.
Step 2 Our server mode
Our server requests the address and reports its time to first byte, which includes DNS lookup, the TCP connection and the TLS handshake. Any HTTP status counts as an answer, because the host replied. A host that cannot be resolved, or a private address, stops the test with a clear message.
Step 3 Your browser mode
Your browser sends a HEAD request in no-cors mode and times it. The reply is hidden from the page for security reasons, so the only honest outcomes are answered or not answered. A request that fails for any reason, including DNS errors and refused connections, counts as lost, never as a reply. Plain http:// hosts cannot be tested this way from a secure page.
Step 4 Stats and spacing
Requests are sent one at a time, 800 milliseconds apart, each with an 8 second timeout. Fastest, average, slowest, jitter and loss update after every reply. Jitter is the average change between one reply and the next, the way ping tools usually report it.
// browser mode timing, from the tool source
var t0 = performance.now();
fetch(url, {
method: 'HEAD', mode: 'no-cors', cache: 'no-store', signal: ctrl.signal
}).then(function () {
resolve({ reachable: true, ms: performance.now() - t0 });
}).catch(function () {
resolve({ reachable: false }); // never counted as a reply
});
This measures application layer latency, not network layer latency. An HTTP request has to complete a TCP handshake, and for HTTPS a TLS handshake on top of that, before the server even looks at it. True ICMP ping skips both and measures only the raw network path. So these numbers will usually run higher than a command line ping to the same host. In browser mode the first request also pays for connection setup, and later ones usually reuse the connection.
Reading the color coded results
| Color | Range | What it suggests |
|---|
| Green | Under 150ms | Healthy for most web and application traffic |
| Yellow | 150 to 400ms | Noticeable but usually tolerable, common on long distance routes or mobile networks |
| Red | Over 400ms, or no answer | Likely to cause visible lag in interactive use, or the host did not answer within 8 seconds |
What leaves your browser
In our server mode, the address you test is sent to our server, which makes the requests. We do not store it. In your browser mode, requests go straight from your browser to the host, so the host sees your IP address and this site never sees the results.
Why cache is disabled
Browser mode requests use cache: 'no-store' and a unique query string, so a cached response cannot come back instantly and produce a meaningless low reading.
HTTP timing, not ICMP
Server or browser measurement
8 second timeout per request
- RFC 792 defines ICMP and the true echo request and reply this tool cannot send from a browser.
- MDN performance.now() documents the high resolution timer used for every measurement here.
- MDN fetch request mode explains what no-cors actually restricts and permits.
- RFC 9293 is the current TCP specification covering the handshake this tool's latency includes and ICMP does not.
Diagnosing reachability
Quick uptime spot checks on a server you manage, comparing perceived latency to a few candidate CDN or hosting regions before committing to one, diagnosing whether a slow feeling site is a network issue or a server processing issue, and confirming a host is reachable at all from your current location and network, which is often the fastest first troubleshooting step when something feels down.