Ping Tool Online Free
Test connectivity and HTTP response time to any domain or IP address. Measure DNS lookup, first byte time, and total latency across multiple runs.
All Network and Web ToolsWhat this actually measures. A browser cannot send an ICMP echo, which is what the ping command in your terminal uses. This tool measures an HTTP or HTTPS round trip instead, so the numbers will read higher than a terminal ping against the same host. That difference is the TLS handshake and the web server, not network latency.
Reading the results. Jitter is the variation between requests, and it matters more than raw latency for calls and video. Loss counts requests that got no answer at all. A host that answers but refuses cross-origin requests may show as no response in limited mode, which is a browser security rule rather than a fault at the other end.
Why this ping tool measures HTTP round trips, not real ICMP packets
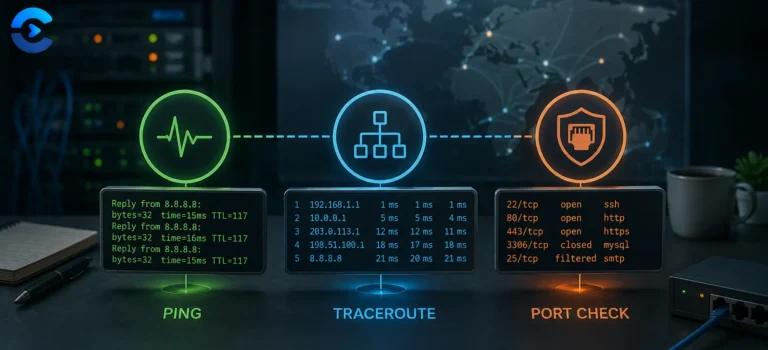
The word ping, in networking, means one specific thing: an ICMP echo request sent to a host, and an ICMP echo reply sent back, as defined in RFC 792. That protocol operates below the transport layer, using raw sockets that require operating system level privileges to open. Browsers do not expose raw sockets to JavaScript, full stop. No browser setting, extension, or workaround changes that, it is a deliberate sandboxing decision that keeps a web page from crafting arbitrary network packets.
So what this tool reports as milliseconds is something different and worth naming precisely: the round trip time of an HTTP HEAD request, timed with the browser’s own performance.now() high resolution clock. It is a real, meaningful latency measurement, just not the same measurement true ICMP ping produces, and the two numbers will not match exactly even against the same host.
What actually happens on each request
performance.now() immediately before the request goes out. This clock is sub millisecond accurate and unaffected by system clock adjustments, unlike Date.now().
fetch() call requests https://{host} with method HEAD and mode no-cors. The no-cors mode is what makes this work across arbitrary domains at all, it tells the browser it is fine to send the request even though the response body cannot be read back, which is exactly what a timing measurement needs and nothing more.
AbortError from the 5 second timeout is counted as a real timeout.
Reading the color coded results
| Color | Range | What it suggests |
|---|---|---|
| Green | Under 150ms | Healthy for most web and application traffic |
| Yellow | 150 to 400ms | Noticeable but usually tolerable, common on long distance routes or mobile networks |
| Red | Over 400ms, or timeout | Likely to cause visible lag in interactive use, or the host is unreachable within 5 seconds |
Data leaving your browser
Each ping request goes straight from your browser to the host you specify, with no intermediary server on our side. This site never sees the host you tested or the results, since the entire measurement happens client side.
Why cache is disabled
The request uses cache: 'no-store' specifically so a cached response from a previous load does not return instantly and produce an artificially low, meaningless reading.
- RFC 792 defines ICMP and the true echo request and reply this tool cannot send from a browser.
- MDN performance.now() documents the high resolution timer used for every measurement here.
- MDN fetch request mode explains what no-cors actually restricts and permits.
- RFC 9293 is the current TCP specification covering the handshake this tool’s latency includes and ICMP does not.
Diagnosing reachability
Quick uptime spot checks on a server you manage, comparing perceived latency to a few candidate CDN or hosting regions before committing to one, diagnosing whether a slow feeling site is a network issue or a server processing issue, and confirming a host is reachable at all from your current location and network, which is often the fastest first troubleshooting step when something feels down.
Common Questions
FAQ: Ping Tool Online Free
Command-line ping sends ICMP Echo packets, which require OS-level network access. Browsers are sandboxed and cannot send ICMP. This tool measures HTTP response time instead, which reflects real user-facing latency more accurately for web services.
Under 100ms is excellent. 100-300ms is acceptable for most use cases. Over 300ms will be noticeable for interactive web apps. Over 500ms suggests significant routing issues or a server that is geographically far from you.
Yes, enter a bare IP address. The tool will attempt an HTTP connection to that IP. If no web server is running on port 80/443 or CORS blocks the request, the tool will still measure the time to first connection refusal, which gives a useful latency signal.
Network latency varies due to routing path changes, server load, DNS caching (or lack thereof), browser processing overhead, and general internet congestion. Running 8-16 pings and comparing min/avg/max gives a more reliable picture than a single result.
From the blog
How the web actually moves
DNS, TLS, headers and the hops between a click and a page.