

Body Fat Percentage Chart: 5 Exact Bands, Healthy Ranges
A body fat percentage chart only helps if you know which method produced your number and how far to trust it. This cheat sheet gives you the five category bands for men and women, lookup tables for the Navy tape measure and skinfold caliper methods, and the shortcuts to read a result in seconds.
Every body fat percentage chart rests on field methods that estimate. They can differ from a lab scan by several points, so treat every figure here as a range, and talk to a healthcare professional before making medical decisions about body composition.
The body fat percentage chart by sex
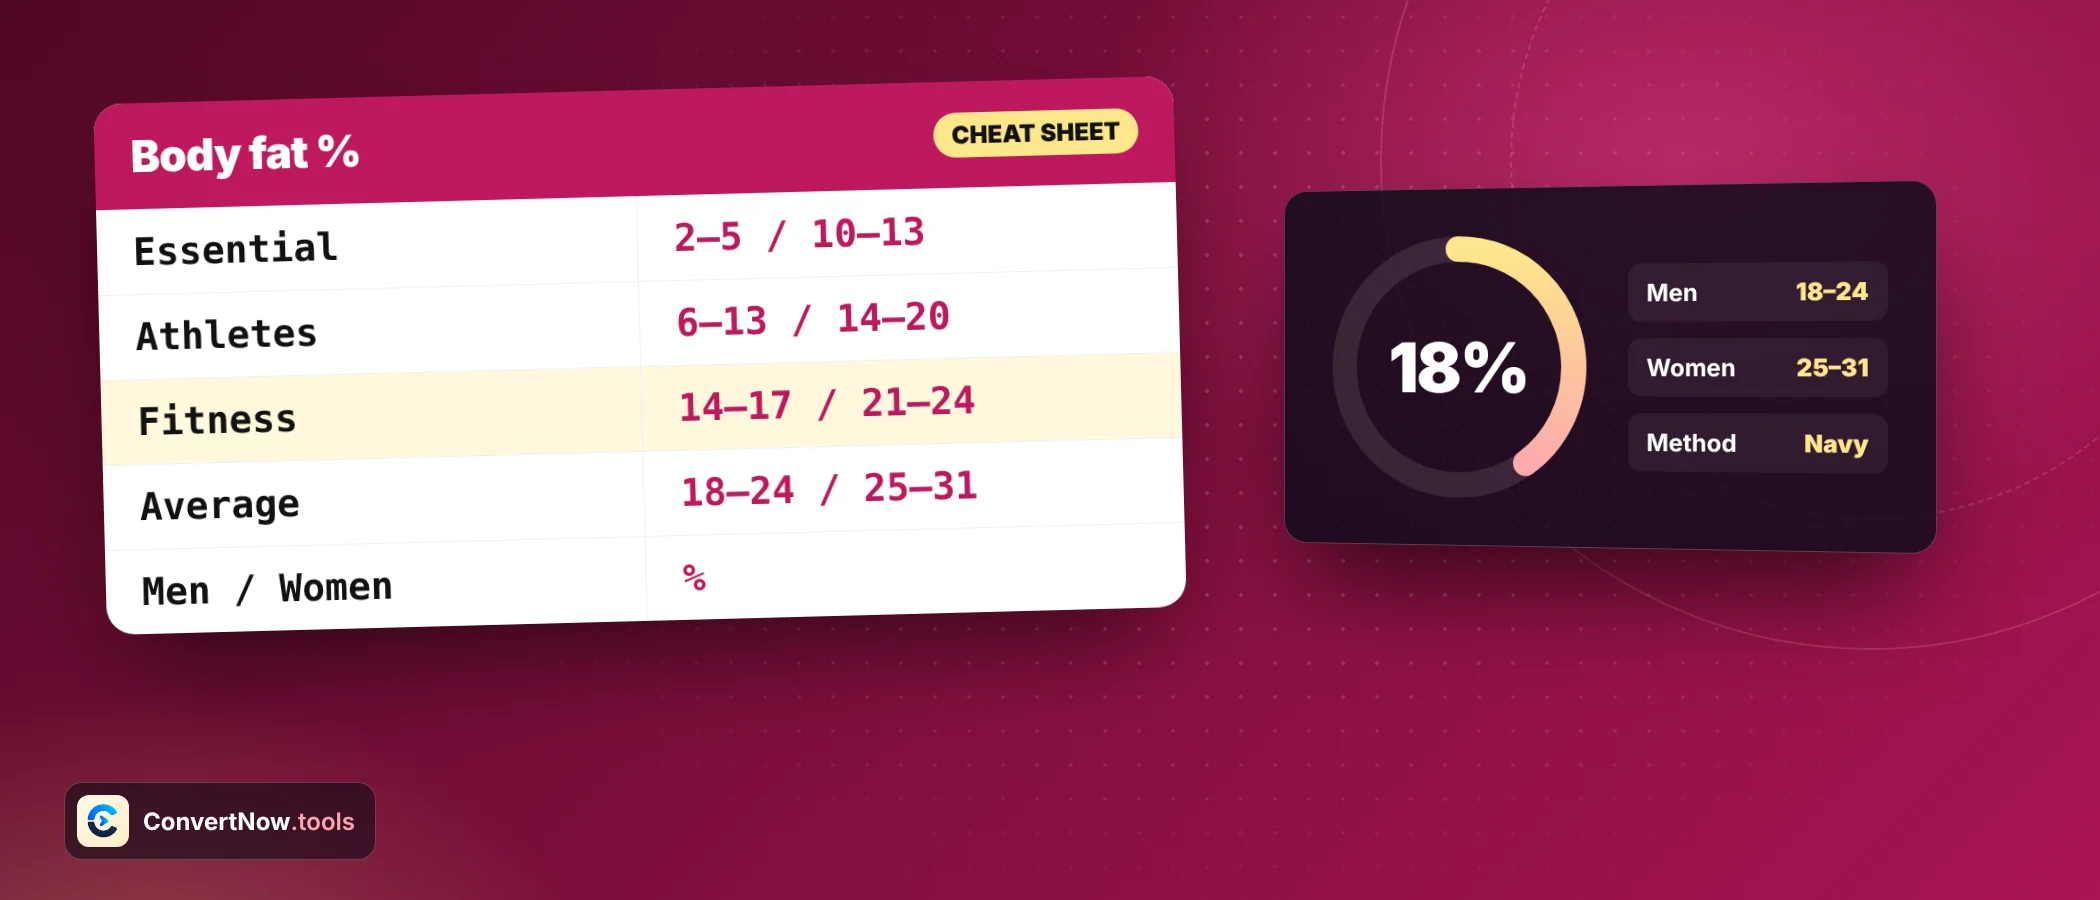
These body fat percentage chart bands follow the categories published by the American Council on Exercise. Filter by sex to see one column at a time. Women carry a higher essential fat floor, tied to hormones and reproduction, which is why the bands are shifted.
| Category | Range | Plain meaning |
|---|---|---|
| Essential fat | 2 to 5% | Minimum needed for basic body function |
| Athletic | 6 to 13% | Common in trained athletes |
| Fitness | 14 to 17% | Lean and active |
| Average | 18 to 24% | Typical for the general population |
| Obese | 25% and above | Higher health risk range |
| Essential fat | 10 to 13% | Minimum needed for basic body function |
| Athletic | 14 to 20% | Common in trained athletes |
| Fitness | 21 to 24% | Lean and active |
| Average | 25 to 31% | Typical for the general population |
| Obese | 32% and above | Higher health risk range |
Staying below the essential band for long periods carries real health risk. The athletic band is the lowest range most people should aim for, and only with professional guidance.
Navy method lookup tables
Every chart needs an input, and the Navy method is the easiest one. It uses a tape measure and was developed by Hodgdon and Beckett at the Naval Health Research Center in 1984. It estimates density from circumferences, then converts density to a percentage with the Siri equation. The tables below use one example body each, with all lengths in centimetres. One inch is 2.54 cm.
| Waist (cm) | Estimated body fat | Band |
|---|---|---|
| 75 | 7.9% | Athletic |
| 80 | 12.4% | Athletic |
| 85 | 16.4% | Fitness |
| 90 | 20.1% | Average |
| 95 | 23.6% | Average |
| 100 | 26.7% | Obese |
| 65 | 23.3% | Fitness |
| 70 | 25.9% | Average |
| 75 | 28.4% | Average |
| 80 | 30.9% | Average |
| 85 | 33.3% | Obese |
| 90 | 35.7% | Obese |
Navy formulas, lengths in cm, log base 10
Men: BF% = 495 / (1.0324 - 0.19077*log10(waist - neck) + 0.15456*log10(height)) - 450
Women: BF% = 495 / (1.29579 - 0.35004*log10(waist + hip - neck) + 0.22100*log10(height)) - 450The estimate is 20.1%, which falls in the 18 to 24% average band for men.
Shortcuts that make the ranges easy to remember
- Waist is the loudest input. Near 90 cm on the male example, every 5 cm of waist moves the estimate by roughly 3 to 4 points.
- Neck pulls the other way. For the same man at 90 cm waist, necks of 35, 38 and 41 cm give 22.2%, 20.1% and 18.0%. That is about 0.7 points per centimetre.
- Height matters less. With a 52 cm waist minus neck gap, 15 cm of extra height lowers the male estimate from 21.5% to 19.0%, so enter height carefully.
- Hips only enter the female formula. They are added to the waist, so a wider hip raises the result.
The neck effect on a body fat percentage chart reading has a real consequence. A tape pulled tight or loose by 1 cm shifts your answer almost a full point, which is why measuring the same way every time matters more than the absolute value.
Skinfold caliper ranges for men
The Jackson Pollock 3 site method sums three skinfolds in millimetres (chest, abdomen and thigh for men) and adds age. The table gives the result for two ages. Women use tricep, suprailiac and thigh sites with a separate equation, so use the calculator for them.
| Sum of 3 skinfolds (mm) | Age 30 | Age 50 | Band at age 30 |
|---|---|---|---|
| 30 | 9.1% | 11.3% | Athletic |
| 45 | 13.6% | 15.9% | Athletic |
| 60 | 17.9% | 20.2% | Fitness |
| 75 | 22.0% | 24.4% | Average |
| 90 | 25.9% | 28.2% | Obese |
| 105 | 29.4% | 31.8% | Obese |
| 120 | 32.7% | 35.1% | Obese |
Age shifts the same skinfold sum by about 2 points between 30 and 50. The 7 site version samples more places and tends to track lab density more closely, but accuracy still depends on who is pinching and where.
Jackson Pollock 3 site, male
density = 1.10938 - 0.0008267*sum + 0.0000016*sum*sum - 0.0002574*age
BF% = 495 / density - 450Fat mass and lean mass from your reading
Once you read a percentage off the body fat percentage chart, split your body weight into two parts. Fat mass is weight times the percentage. Lean mass is everything else: muscle, bone, organs and water.
| Weight | Body fat | Fat mass | Lean mass |
|---|---|---|---|
| 65 kg | 22% | 14.3 kg | 50.7 kg |
| 80 kg | 18% | 14.4 kg | 65.6 kg |
| 80 kg | 25% | 20.0 kg | 60.0 kg |
Look at the last two rows. Two people of the same weight can differ by 5.6 kg of fat. This is exactly the gap that a scale hides and a body fat percentage chart exposes.
Fill the body fat percentage chart with the Navy, 3 site or 7 site method, enter your measurements in metric or imperial, and see body fat, fat mass, lean mass and category. Nothing is uploaded.
Open the Body Fat Percentage CalculatorHow to use the ranges in three situations
Keep one method and one measurer. A move from 22.0% to 20.1% over 8 weeks on the same tape is a real signal, because the errors tend to repeat in the same direction each time.
Compare numbers only with your own earlier numbers. A different method, even on the same day, can disagree by several points.
Look up your sex, then find the range that contains your result. A man at 20.1% sits in the 18 to 24% average band, and a woman at 28.4% sits in the 25 to 31% average band.
Near a boundary, treat the result as a range. With a typical error of 3 to 4 points, a reading of 24% could belong to two neighbouring bands.
Pick a goal one band away, not three. A man at 26.7% who aims for 20% needs to lose about 5.4 kg of fat at 80 kg: 80 times 0.267 is 21.4 kg now, and 80 times 0.20 is 16.0 kg then, ignoring changes in lean mass.
Revisit the number every 4 to 8 weeks. Weekly readings mostly record noise.
Notice that the goal example holds weight fixed for simplicity. In real life, losing fat also lowers weight, so the percentage moves a little faster than this arithmetic suggests.
Pick a measuring method: quick comparison
| Method | Needs | Strength | Weakness |
|---|---|---|---|
| US Navy | Tape measure | Zero equipment, fast | Sensitive to neck and waist errors, poor for unusual builds |
| 3 site caliper | Calipers, a helper | Uses real fat folds | Depends on pinch technique |
| 7 site caliper | Calipers, a trained measurer | Closer to lab density | Takes time, tester variation |
| DEXA or hydrostatic | Clinic or lab | Reference standard for field methods | Cost and access |
Measurement checklist for repeat readings
Body fat is one measure among several. For a ratio of height to weight, use the BMI Calculator. To plan intake from your result, try the Macro Calculator or the TDEE Calculator.
Body fat percentage chart questions
What is a healthy body fat percentage chart range?
Using the ACE bands, 14 to 24 percent is fitness to average for men and 21 to 31 percent for women. Essential fat is the minimum for function, 2 to 5 percent for men and 10 to 13 percent for women.
How accurate is the Navy body fat method?
It can be several points off a DEXA scan, and it is less reliable for builds that are far from typical. It is best used to follow your own change over time.
Where do I measure for the Navy method?
Waist at the navel, neck just below the larynx, and for women the hip at its widest point. Keep the tape level and do not pull it tight.
Where does 25 percent body fat sit on the body fat percentage chart?
For men 25 percent is the start of the obese band. For women it is the start of the average band, which runs to 31 percent.
Navy method or caliper, which is better?
With good technique the 7 site caliper is usually closer to lab results. The Navy method needs only a tape measure and is easy to repeat.
How do I calculate fat mass and lean mass?
Multiply body weight by the body fat percentage to get fat mass, then subtract it from weight for lean mass. At 80 kg and 18 percent, fat mass is 14.4 kg and lean mass is 65.6 kg.
Sources: Body fat percentage, Wikipedia · ACE body composition percentage chart