

FIRE Calculator: 12 Essential Terms Explained Clearly
A FIRE calculator asks for a dozen numbers and returns a probability, yet many people fill in the boxes without knowing what each one does. FIRE stands for Financial Independence, Retire Early, and every term in it has a precise meaning that changes your result. This guide defines each one, with worked figures, so the output makes sense.
The terms fall into four groups: money, markets, method and styles. Read them in that order and every box in a FIRE calculator will make sense.
What a FIRE calculator actually measures
Simple retirement calculators assume a steady yearly return. Real markets do not behave that way. The FIRE Calculator draws a random return for each year, grows your portfolio, adds contributions before retirement and subtracts spending after it. It repeats that 1,000 times and reports how many runs stayed above zero.
The money terms: FIRE number and withdrawal rate
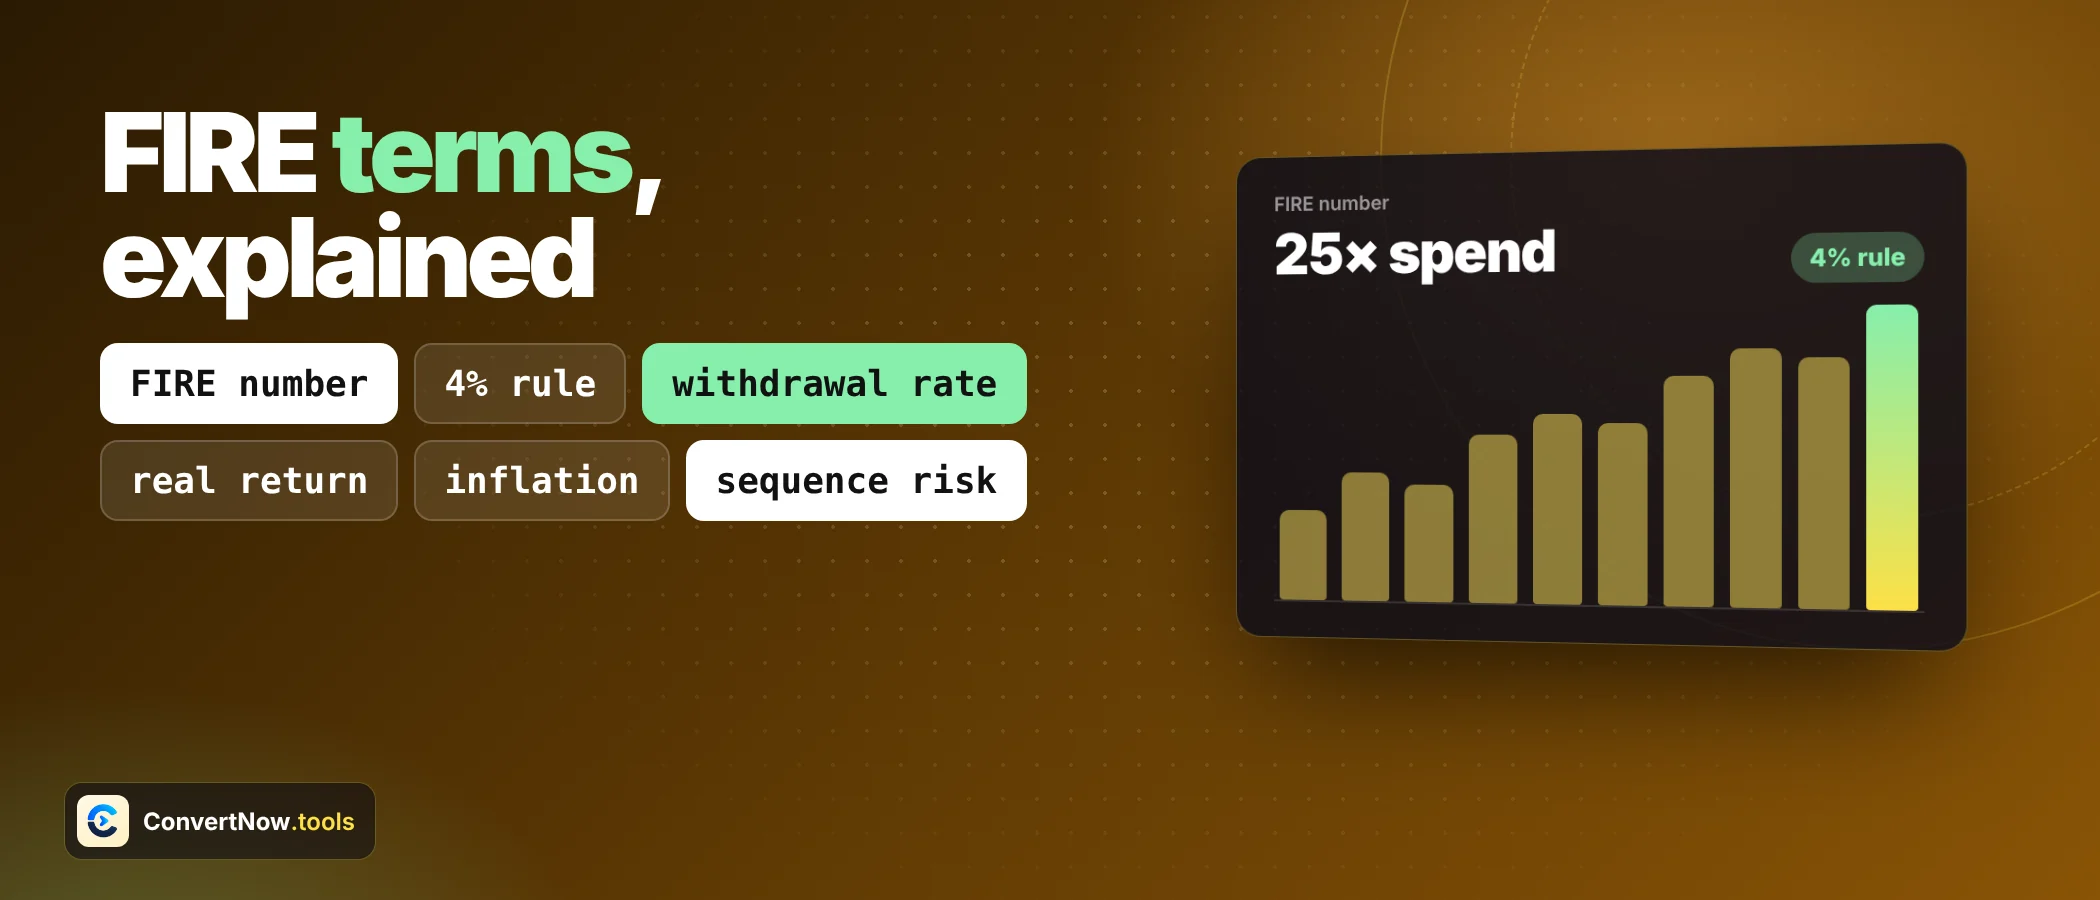
The FIRE number is the portfolio size at which you can stop working. The formula is annual retirement spending divided by the safe withdrawal rate. Spend $50,000 a year, withdraw 4 percent, and the number is $1,250,000.
The 4 percent figure traces back to William Bengen in 1994 and the later Trinity study, which tested stock and bond mixes on United States data from 1925 to 1995 over 30 year periods. Early retirees face longer horizons, and some researchers suggest 3.25 to 3.5 percent for them, which is about 30 times spending.
| Withdrawal rate | Multiple of spending | Spending $40,000 | Spending $50,000 | Spending $60,000 |
|---|---|---|---|---|
| 3.0 percent | 33.3 times | $1,333,333 | $1,666,667 | $2,000,000 |
| 3.25 percent | 30.8 times | $1,230,769 | $1,538,462 | $1,846,154 |
| 3.5 percent | 28.6 times | $1,142,857 | $1,428,571 | $1,714,286 |
| 4.0 percent | 25.0 times | $1,000,000 | $1,250,000 | $1,500,000 |
| 5.0 percent | 20.0 times | $800,000 | $1,000,000 | $1,200,000 |
Notice how a small change in the rate moves the target a lot. Dropping from 4 to 3.5 percent adds $178,571 to the $50,000 case in any FIRE calculator. In a Monte Carlo FIRE calculator, the withdrawal rate only feeds the FIRE number. The success rate comes from the simulation.
Market terms: returns, volatility and inflation
A good FIRE calculator asks for a pre retirement return and a lower post retirement return, because many people shift toward bonds as they retire. Both are nominal, meaning before inflation is removed. Inflation is then applied to your contributions and to your spending.
Volatility is the standard deviation of yearly returns. In a normal distribution, about 68 percent of years land within one standard deviation of the average and about 95 percent within two. With a 7 percent average and 15 percent volatility, two thirds of years fall between minus 8 and plus 22 percent, and nineteen of twenty between minus 23 and plus 37.
| Years from now | At 2 percent | At 3 percent | At 4 percent |
|---|---|---|---|
| 10 | $60,950 | $67,196 | $74,012 |
| 20 | $74,297 | $90,306 | $109,556 |
| 30 | $90,568 | $121,363 | $162,170 |
A real return is what remains after inflation. The exact formula is (1 + nominal) ÷ (1 + inflation) minus 1. With 7 percent nominal and 3 percent inflation, the real return is 3.88 percent, not 4.
Method terms: Monte Carlo, success rate and percentiles
A Monte Carlo simulation runs the same calculation many times with random inputs. Here each year gets a return drawn from a normal distribution around your average, using the Box Muller transform. Each full run is one possible future.
The success rate is the share of runs where the balance never hit zero before your plan age. A 90 percent rate means 900 of 1,000 futures worked. A run that reaches zero is clamped there and counted as a failure.
The percentile bands show the spread. The 50th percentile is the median future. The 10th is a pessimistic case where 90 percent of runs did better, and the 90th is an optimistic one. Do not read the median as a promise. Read the 10th percentile as a warning.
A normal distribution understates fat tails and long bad stretches. Taxes, fees and state pensions are not modelled. Treat the output of any FIRE calculator as a directional signal, not a guarantee.
Sequence of returns risk, shown with numbers
Two portfolios can have the same average return and finish far apart. Order matters once you withdraw money. Start with $1,000,000, withdraw $50,000 a year and use five yearly returns that average exactly zero, in two different orders.
| Year | Bad years first (return) | Balance | Good years first (return) | Balance |
|---|---|---|---|---|
| 1 | minus 20 percent | $750,000 | +20 percent | $1,150,000 |
| 2 | minus 10 percent | $625,000 | +10 percent | $1,215,000 |
| 3 | 0 percent | $575,000 | 0 percent | $1,165,000 |
| 4 | +10 percent | $582,500 | minus 10 percent | $998,500 |
| 5 | +20 percent | $649,000 | minus 20 percent | $748,800 |
The gap after five years is $99,800, and a FIRE calculator shows it widening after that. This is why a single average return in a simple calculator is misleading, and why a simulation that randomizes the order is more honest.
Use the FIRE calculator to run 1,000 simulations on your own numbers and see the success rate, the median path and the pessimistic path in seconds.
Open the FIRE CalculatorThe style terms: Lean, Fat, Coast and Barista FIRE
| Style | Meaning | Effect on the calculator |
|---|---|---|
| Lean FIRE | Very low spending, so a smaller portfolio is enough | Lower retirement spending input |
| Fat FIRE | A comfortable or generous lifestyle | Higher spending, larger FIRE number |
| Coast FIRE | Invest early, then let growth reach the target without more saving | Set annual contribution to zero after the coast date |
| Barista FIRE | Part time income covers some spending | Use a lower portfolio funded share of spending |
For a Coast FIRE calculator example, take a target of $1,250,000 at current prices at 65. At 35, with a real return of 5 percent, you need 1,250,000 ÷ 1.05 to the power of 30, which is about $289,222 today. At 7 percent, it drops to about $164,209. A higher assumed return flatters the answer, so test both.
Quick glossary
- FIRE
- Financial Independence, Retire Early. A plan to build enough assets to cover living costs without employment.
- FIRE number
- Annual spending divided by the withdrawal rate.
- Safe withdrawal rate
- The share of the starting portfolio you take out in year one, then adjust for inflation.
- Accumulation phase
- The years of saving, before the retirement age.
- Withdrawal phase
- The years after retirement, when spending comes out of the portfolio.
- Nominal return
- Return before removing inflation.
- Real return
- Return after removing inflation.
- Volatility
- Standard deviation of yearly returns. Higher means a wider spread of outcomes.
- Monte Carlo simulation
- Many random trials of the same plan to see the range of results.
- Success rate
- The share of simulated runs that never ran out of money.
- Percentile
- The value below which a given share of runs fall, such as the 10th percentile.
- Sequence of returns risk
- The danger that poor returns early in retirement do outsized damage.
How the terms connect inside the FIRE calculator
| You enter | Term it feeds | What changes |
|---|---|---|
| Current age, retirement age, plan age | Accumulation and withdrawal phases | Years of saving and years of spending |
| Savings and annual contribution | Accumulation phase | Starting balance at retirement |
| Annual retirement spending | FIRE number and withdrawal phase | Size of each yearly withdrawal |
| Pre and post retirement return | Nominal return | Average growth in each phase |
| Volatility | Spread of outcomes | Width of the fan chart |
| Inflation | Real purchasing power | Growth of contributions and spending |
- Set the timelineEnter your age, a target retirement age and a plan age such as 95, which is a conservative horizon.
- Enter money in and outUse current prices for spending. The calculator inflates it each year.
- Choose FIRE calculator market assumptionsA 7 percent pre retirement return, 5 percent after, 15 percent volatility and 3 percent inflation are common starting points to test, not forecasts.
- Read the success rate and the 10th percentileAim for a comfortable success rate, and check the pessimistic line, not only the median.
To see how savings grow without randomness, use the Compound Interest Calculator. The Inflation Calculator shows what your spending will cost later, and the SIP Calculator models regular monthly investing.
Frequently asked questions
What is a FIRE number in a FIRE calculator?
It is the portfolio size that supports your spending, found by dividing annual retirement spending by the withdrawal rate. At 4 percent that is 25 times your yearly spending.
What does the success rate mean in a Monte Carlo FIRE calculator?
It is the percentage of simulated futures where your money lasted to the plan age. A 90 percent rate means 900 of 1,000 runs finished above zero.
Is the 4 percent rule safe for early retirement?
It was built on 30 year periods, and early retirees need longer ones. Some researchers suggest 3.25 to 3.5 percent for them, so test lower rates too.
What is sequence of returns risk?
It is the damage caused by poor market returns early in retirement, when withdrawals shrink the balance before it can recover.
Why is volatility a FIRE calculator input?
It sets how widely yearly returns vary around the average. A higher value widens the range of outcomes and usually lowers the success rate.
Does the FIRE calculator include taxes or pensions?
No. Taxes, fees and state pensions are not modelled, so adjust your spending input to reflect them.
Sources: FIRE movement, including the 25 times rule and Coast FIRE · Trinity study