

Sample Size Calculator: 5 Simple Uses for Every Job Role
Every survey starts with the same question: how many people do I need to ask? A sample size calculator answers it from three choices, which are the confidence level, the margin of error and the population, and the right choices depend on your job far more than on the maths.
Below, five roles each get a real scenario, the settings that suit it and the number that comes out. If you want to try your own figures as you read, the sample size calculator runs the same formula in your browser.
What a sample size calculator actually computes
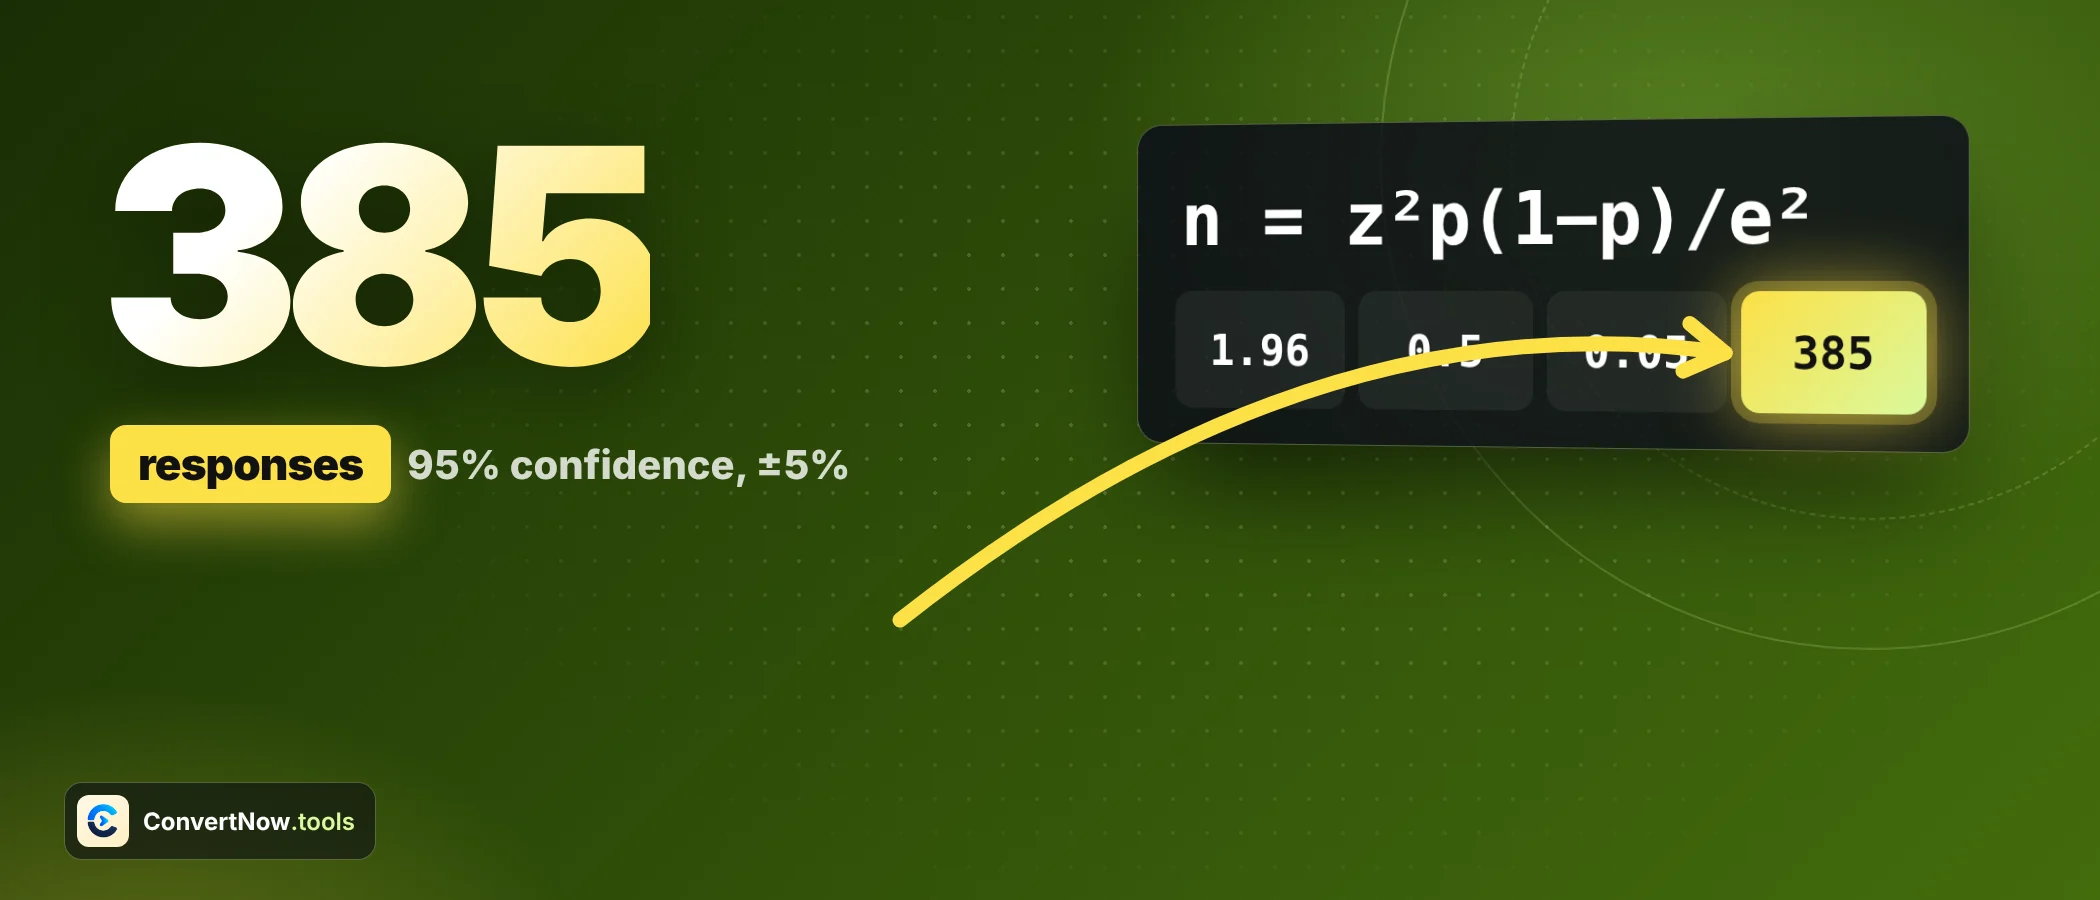
The calculator uses the Cochran formula for a proportion. In plain terms: n₀ = Z² × p × (1 − p) ÷ e². Z comes from your confidence level, p is your guess of how the population splits, and e is the margin of error written as a decimal.
If you know the total population N, a correction follows: n = n₀ ÷ (1 + (n₀ − 1) ÷ N). The result is always rounded up, so 384.16 becomes 385. A partial person cannot answer a survey, and rounding down would quietly weaken your result.
| Confidence level | Z score | Typical use |
|---|---|---|
| 90% | 1.645 | Quick internal checks |
| 95% | 1.96 | Standard for reports and papers |
| 99% | 2.576 | High stakes or regulated work |
| 99.9% | 3.291 | Rare, very high precision |
Margin of error is where most people feel the impact. It is the plus or minus range around your result. Here is what different sample sizes buy you at 95% confidence when the answer is close to 50%. A sample size calculator makes that trade visible.
| Responses | Margin of error | A result of 60% really means |
|---|---|---|
| 100 | ±9.8 points | 50.2% to 69.8% |
| 400 | ±4.9 points | 55.1% to 64.9% |
| 1,000 | ±3.1 points | 56.9% to 63.1% |
Pick your role: five scenarios with real settings
Choose the tab that matches your situation. Each one shows the inputs to enter and the output you should expect.
Scenario: a final year thesis on study habits at a university with 12,000 students. Your supervisor expects 95% confidence and a 5% margin of error. You have no earlier data, so you use 50% for the expected proportion.
Inputs: 95%, 5%, 50%, population 12,000. The infinite population figure is 384.16. With the correction it falls to 372.27, which rounds up to 373 responses.
Tip: write the formula and the inputs in your methods section. Reviewers like to see where the number came from, and 373 with a stated formula is more convincing than a round 400 with no reason. State which sample size calculator or formula you used.
Scenario: a poll of voters in a city of 250,000 people, where the client wants a margin of error of 3%.
Inputs: 95%, 3%, 50%, population 250,000. Result: 1,063 responses. The population is large, so the correction barely moves the 1,068 you would get with an unknown population.
Tip: the calculator assumes a random sample. If you sample by clusters, such as households, multiply the answer by a design effect. A design effect of 1.5 turns 385 into 577. No sample size calculator can fix a biased frame.
Scenario: a satisfaction survey for 5,000 active users of an app. You want a directional read to guide the next sprint, not a published figure.
Inputs: 90%, 10%, 50%, population 5,000. Result: 67 responses. That is a fraction of the 385 you would need at 95% and 5%, and it is fine for a decision that is easy to reverse.
Tip: plan invites, not responses. If 20% of users reply, 67 completed answers needs about 335 invitations.
Scenario: an engagement survey in a company of 800 employees, run once a year.
Inputs: 95%, 5%, 50%, population 800. Result: 260 responses, which is 32.5% of the staff. Because the group is small, correction does real work: the infinite figure of 385 is 48% of the company.
Tip: if you also report by department, each department is its own small population. A team of 40 needs 37 answers at 95% and 5%, so most teams need nearly every person to reply. Run the sample size calculator once per department.
Scenario: a program serves 1,000 households. A past report said about 20% lacked reliable internet, and you want to check it again.
Inputs: 95%, 5%, 20%, population 1,000. Result: 198 responses. Using 50% instead would give 278, so a believable earlier figure saves 80 interviews.
Tip: only lower the expected proportion if your earlier number is trustworthy. If you are not sure, keep 50%, which can never leave you short.
How population size changes the answer
People often assume a bigger population always needs a bigger sample. It does not. Past about 20,000 the answer barely moves, which is why national polls use around 1,000 people. For small groups the effect is large.
| Population | 5% margin | 3% margin | 10% margin |
|---|---|---|---|
| 200 | 132 | 169 | 66 |
| 500 | 218 | 341 | 81 |
| 1,000 | 278 | 517 | 88 |
| 5,000 | 357 | 880 | 95 |
| 10,000 | 370 | 965 | 96 |
| 100,000 | 383 | 1,056 | 96 |
| 1,000,000 | 385 | 1,066 | 97 |
With Z = 1.96, p = 0.5 and e = 0.05, the formula gives (3.8416 × 0.25) ÷ 0.0025 = 384.16. Round up and you get 385. Every guide that quotes it is using this exact line.
Choosing the expected proportion
The expected proportion p is your best guess of the answer you will get. The term p × (1 − p) is largest at 50%, so 50% always gives the biggest sample and the safest one. A lower or higher guess shrinks the requirement, but only use it with real evidence behind it.
| Expected proportion | Responses needed |
|---|---|
| 50% | 385 |
| 30% | 323 |
| 20% | 246 |
| 10% | 139 |
| 5% | 73 |
Notice the symmetry. A guess of 10% and a guess of 90% give the same answer, because p × (1 − p) is identical for both.
From responses to invitations
The calculator gives completed responses. Nobody answers every invitation, so divide by your expected response rate. This is the step most plans forget. A sample size calculator does not know your response rate.
| Response rate | Invitations to send | Typical channel |
|---|---|---|
| 30% | 1,284 | Customer panel or loyal members |
| 20% | 1,925 | Email to existing users |
| 12% | 3,209 | Cold email list |
| 8% | 4,813 | Pop up or public link |
Check the student example by hand
Seeing the arithmetic once makes the tool feel less like a black box. Here is the thesis case from the first tab, worked step by step.
- Square the Z score1.96 × 1.96 = 3.8416.
- Multiply by p and 1 − p3.8416 × 0.5 × 0.5 = 0.9604.
- Divide by e squared0.05 × 0.05 = 0.0025, so 0.9604 ÷ 0.0025 = 384.16.
- Apply the correction for 12,000 students384.16 ÷ (1 + 383.16 ÷ 12,000) = 372.27.
- Round upThe answer is 373 completed responses.
The infinite population figure is 385, but the correction for N = 800 brings it to 260. That is roughly one third of the company.
What it cannot do
A sample size calculator for surveys sizes a single proportion. It does not size a test that compares two groups, such as two versions of a landing page. That job needs a power calculation with an expected difference between the groups. It also cannot fix a biased sample. A thousand responses from a self selected group are still self selected.
- It assumes simple random sampling, so every person has an equal chance of being chosen.
- It assumes honest, complete answers. Missing data raises the numbers you need.
- Margin of error is about sampling chance only. Poor question wording adds error that no formula measures.
- If you want to describe the answers afterwards, the statistics calculator gives you the mean, median and spread.
- To turn counts into shares, the percentage calculator is the quick route.
Enter your own confidence level, margin of error, expected proportion and population, and read the required sample size straight away. The sample size calculator runs in your browser.
Open the Sample Size CalculatorSample size calculator questions people ask
What is a good sample size calculator result for a survey?
For a large population, 385 responses gives a 5% margin of error at 95% confidence. For a rougher read, around 100 responses gives about plus or minus 10 points.
What confidence level should I use?
Use 95% unless you have a reason not to. Choose 99% when a wrong conclusion is costly, and 90% for quick, reversible decisions.
Does population size matter for sample size?
Only when the population is small. Once it passes roughly 20,000, the required sample barely changes, but under 1,000 the correction can cut the number by a lot.
Why does a sample size calculator round up?
A sample of 384.16 people is impossible, and rounding down to 384 would give a slightly larger margin of error than you asked for. Rounding up is the safe choice.
What should I enter if I do not know the expected proportion?
Enter 50%. It maximises the variance in the formula, so the answer can never be too small.
Can I use a sample size calculator for an A/B test?
Only for a single proportion question. Comparing two versions needs a power calculation based on the size of the difference you want to detect.
Sources: Sample size determination, Wikipedia

